Please refer to important disclosures at the end of this report
1
(` cr) 3QFY20
3QFY19 % yoy 2QFY20 % qoq
Revenue
788 518 52 623 27
EBITDA
54 29 87 37 48
OPM (%)
6.9 5.6 130bp
5.9 99bp
Reported PAT
25 4 522 12 104
Source: Company, Angel Research
For 3QFY2020, Amber Enterprises Ltd (Amber) posted strong set of numbers,
both
on top-line and bottom-line front. Consolidated revenue grew by ~52
% yoy to
`788cr. On the bottom-line front,
Amber reported consolidated PAT growth of
~552% yoy to `25cr on the back of strong top-line growth and
strong operating
margin improvement.
Top-line grew ~52%: The company’s consolidated top-line grew by ~52
% yoy to
`788cr on the back of strong volume growth which ~75% yoy
(mainly due to
addition of new customers, industry growth and increased demand by existing
customers due to increase in custom duty hike). During the 9mFY20, Revenu
es from
“RAC” and “Components & Mobile Applications” business grew by ~72% & ~
68%
respectively
Strong volume growth and operating margin improvement
boosted the overall
profitability: On the bottom-line front, A
mber reported consolidated PAT growth of
~552% yoy to `25cr on the back of strong top-line growth and
strong operating
margin improvement (130bp).
Outlook and Valuation: We expect Amber to report consolidated n
et profit (reported)
CAGR of ~40% to ~`258cr over FY2019-22E on the back of top-
line growth of
~25% over the same period. Considering the pick-up in AC demand and
deriving
synergy
benefits from its new acquisitions, we maintain BUY on the stock with a
revised target Price of `1,830.
Key Financials (consolidated)
Y/E March (` cr)
FY2019 FY2020E FY2021E
FY2022E
Net sales 2,752 3,993 4,665 5,362
% chg 29.3 45.1 16.8 14.9
Adj. Net profit 95 175 210 258
% chg 50.3 86.6 20.3 22.9
EBITDA margin (%) 7.7 8.7 8.6 8.8
EPS (`) 29.8 55.6 66.9 82.2
P/E (x) 51.8 27.7 23.1 18.8
P/BV (x) 4.8 4.1 3.5 2.9
RoE (%) 9.3 14.8 15.1 15.7
RoCE (%) 12.0 17.0 17.7 18.7
EV/Sales (x) 1.8 1.3 1.1 0.9
EV/EBITDA (x)
23.7
14.8
12.7
10.7
Source: Company, Angel Research Note
BUY
CMP `1,535
Target Price `1,830
Investment Period 12 months
Stock Info
Sector Consumer Durable
Market Cap (` cr) 4,827
Net Debt (` cr)
203
Beta 0.9
52 Week High / Low 1,639/621
Avg. Daily Volume 5,215
Face Value (`) 10
BSE Sensex 39,872
Nifty 11,707
Reuters Code AMBER.BO
Bloomberg Code AMBER.IN
Shareholding Pattern (%)
Promoters
44.0
MF / Banks / Indian
6.0
FII / NRIs / OCBs
12.9
Indian Public/Others
37.1
Abs.(%) 3m 1yr 3yr
Sensex (1.1)
9.0 41.2
Amber 42.6 101.5 -
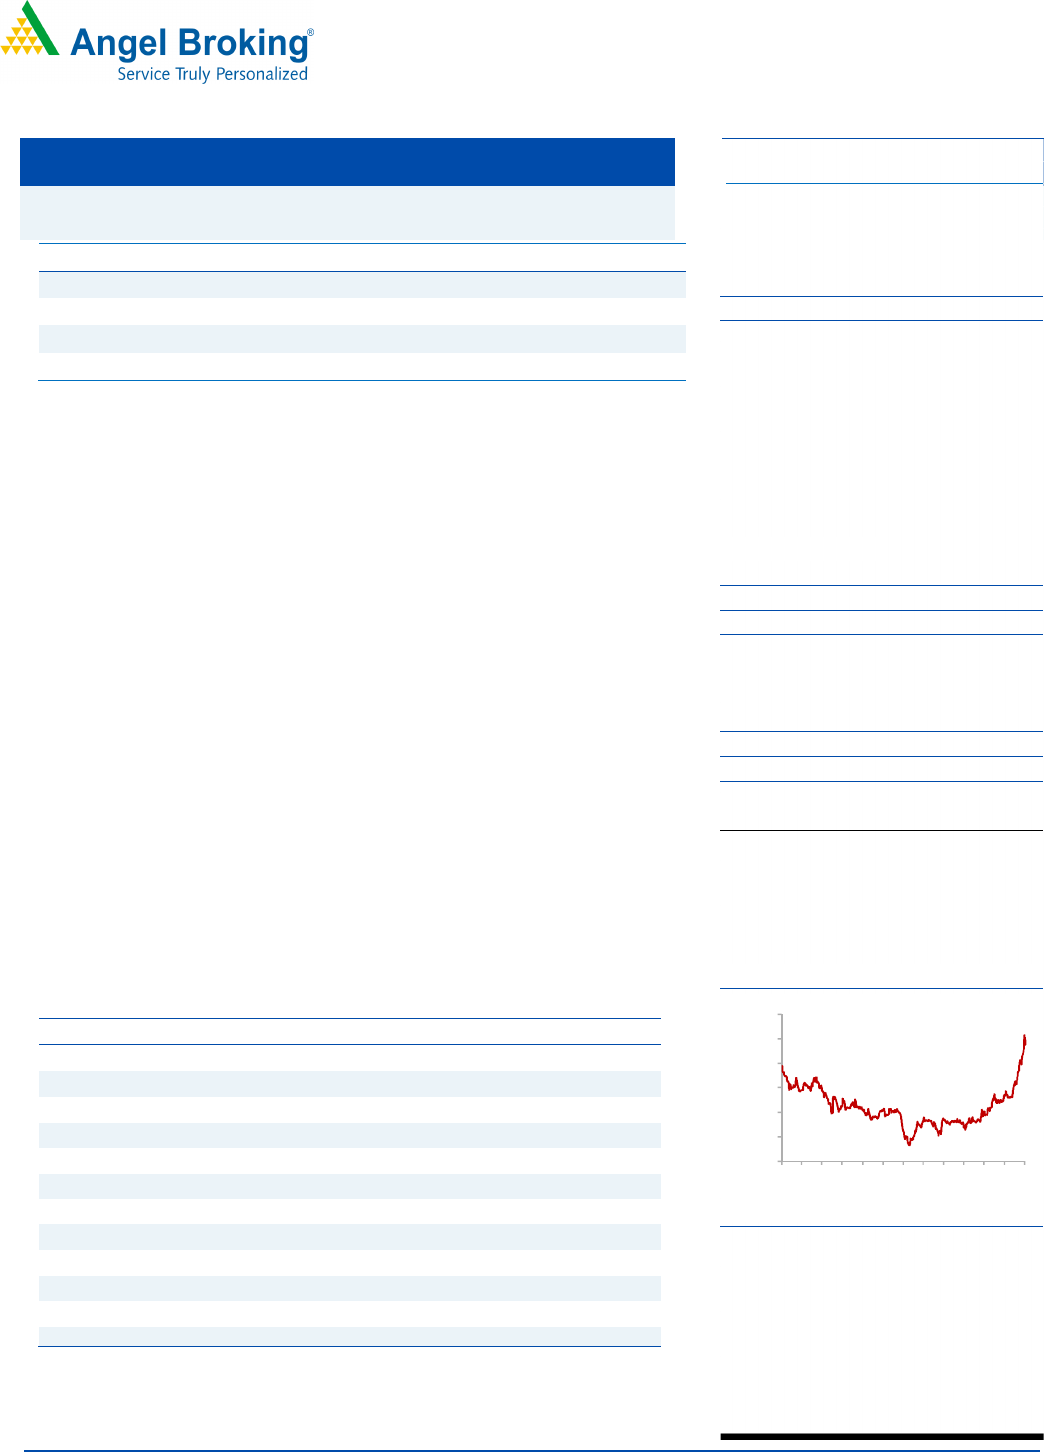
Historical share price chart
Source: Company, Angel Research
Amarjeet S Maurya
022-40003600 Ext: 6831
amarjeet.maurya@angelbroking.com
Amber Enterprises India
Performance Update
500
700
900
1100
1300
1500
1700
Jan-18
Mar-18
May-18
Jul-18
Sep-18
Nov-18
Jan-19
Mar-19
May-19
Jul-19
Sep-19
Nov-19
Jan-20
3
QFY2020 Result Update | Consumer Durable
February 5, 2020
Amber Enterprises India| 3QFY2020 Result Update
February 5, 2020
2
3QFY2020 Performance
Y/E March (` cr) 3QFY20 3QFY19
% yoy
2
QFY20
% qoq
9mF
Y20
9m
FY19
% chg
Net Sales
788
518
52.2
623
26.5
2,648
1,556
70.2
Consumption of RM
654.0
442
47.9
513.9
27.3
2,206
1,309
68.5
(% of Sales)
82.9
85.3
82.4
40.4
83.3
84.1
Staff Costs
27
13
112.2
25
7.7
75.7
41.6
81.9
(% of Sales)
3.4
2.5
4.0
2.9
2.7
Other Expenses
53
34
55.3
48
11.7
158.9 105.8
50.2
(% of Sales)
6.7
6.6
7.6
6.0
6.8
Total Expenditure
734
489
50.1
587
25.2
2,440
1,456
67.6
Operating Profit
54
29
87.5
37
47.8
207
100
107.9
OPM
6.9
5.6
5.9
7.8
6.4
Interest
11
6
73.0
11
(0.7)
32
17
91.6
Depreciation
21
16
34.9
21
0.6
63
46
38.0
Other Income
2
0
(0)
8
5
PBT (excl. Ext Items)
24
7
241.4
5
427.6
121
42
187.0
Ext (Income)/Expense
PBT (incl. Ext Items)
24
7
241.4
4.64
427.6
120.65
42
187.0
(% of Sales)
3.1
1.4
0.7
4.6
2.7
Provision for Taxation
(0)
3
(8)
19
14
(% of PBT)
(1.3)
44.3
(162.5)
16.0
33.5
Reported PAT
25
4
521.8
12.2
103.7
101
28
262.6
PATM
3.1
0.8
2.0
3.8
1.8
Minority Interest After NP
Extra-ordinary Items
Reported PAT
25
4
522
12.2
103.7
101
28
262.6
Source: Company, Angel Research

Amber Enterprises India| 3QFY2020 Result Update
February 5, 2020
3
Outlook and Valuation
We expect Amber to report consolidated net profit (reported) CAGR of ~40% to
~`258cr over FY2019-22E on the back of top-line growth of ~25% over the same
period. Considering the pick-up in AC demand and deriving synergy benefits from
its new acquisitions, we maintain BUY on the stock with a revised target Price of
`1,830.
Downside risks to our estimates
Client concentration: Amber’s business is dependent on certain principal customers
and the loss of or a significant reduction in purchases by such customers could
adversely affect its business, financial condition, results of operations and future
prospects
Downward trend in OEM/ODM business: In recent years, RAC brands have
increasingly outsourced the manufacturing of their products to OEM/ODM players
like Amber. However, there can be no assurance that they will continue to do so in
the future.
Changing preferences, advancement in technology: The markets in which
company’s customers compete are characterized by consumers and their rapidly
changing preferences, advancement in technology and other related factors
including lower manufacturing costs. Hence, the company may be affected by any
disruptions in the industry
Company Background
Amber Enterprises India Ltd. (Amber) is the market leader in the room air
conditioners (RAC) outsourced manufacturing space in India. It is a one-stop
solutions provider for the major brands in the RAC industry and currently serves eight
out of the ten top RAC brands in India. Its growing manufacturing capabilities and
scale put it in a sweet spot to capture the underpenetrated RAC market in India.

Amber Enterprises India| 3QFY2020 Result Update
February 5, 2020
4
Consolidated Profit & Loss Statement
Y/E March (` cr)
FY2018
FY2019
FY2020E
FY2021E
FY2022E
Net Sales
2,128
2,752
3,993
4,665
5,362
% chg
28.8
29.3
45.1
16.8 14.9
Total Expenditure
1,945
2,539
3,645
4,264
4,890
Raw Material
1,769
2,320
3,350
3,914
4,498
Personnel
50
59
84
103
129
Others Expenses
126
161
212
247
263
EBITDA
184
213
347
401
472
% chg
40.6
16.0
63.2
15.5 17.6
(% of Net Sales)
8.6
7.7 8.7 8.6 8.8
Depreciation& Amortization
49
62
84
89
94
EBIT
135
151
263
312
378
% chg
48.8
11.9
74.9
18.5 21.0
(% of Net Sales)
6.3
5.5 6.6 6.7 7.0
Interest & other Charges
54
25
40
43
45
Other Income
9
10
12
13
14
(% of PBT)
9.8
7.3 5.1 4.6 4.0
Recurring PBT
89
136
235
283
347
% chg
150.4
52.0
73.0
20.2 22.7
Tax
27
41
59
71
87
(% of PBT)
30.3
30.3
25.2
25.2 25.2
PAT (reported)
62
95
176
211
260
Extraordinary Items
-
-
-
-
-
ADJ. PAT
62
95
175
210
258
% chg
181.3
50.3
86.6
20.3 22.9
(% of Net Sales)
2.9
3.4 4.4 4.5 4.8
Basic EPS (`)
19.8
29.8
55.6
66.9
82.2
Fully Diluted EPS (`)
19.8
29.8
55.6
66.9
82.2
% chg
181.3
50.3
86.6
20.3 22.9

Amber Enterprises India| 3QFY2020 Result Update
February 5, 2020
5
Consolidated Balance Sheet
Y/E March (` cr) FY2018
FY2019
FY2020E
FY2021E
FY2022E
SOURCES OF FUNDS
Equity Share Capital 31
31
31
31
31
Reserves& Surplus
861
974
1,148
1,359
1,617
Shareholders Funds
893
1,005
1,180
1,390
1,649
Total Loans
114
248
370
370
370
Deferred Tax Liability 75
93
93
93
93
Total Liabilities 1,082
1,346
1,643
1,853
2,112
APPLICATION OF FUNDS
Gross Block
932
1,090
1,180
1,270
1,360
Less: Acc. Depreciation
222
281
365
454
548
Net Block
710
809
815
816
812
Capital Work-in-Progress
30
34
34
34
34
Investments 6
-
-
-
-
Current Assets
983
1,528
2,294
2,756
3,259
Inventories
396
561
875
1,022
1,205
Sundry Debtors
379
787
1,181
1,431
1,675
Cash
134
45
78
115
165
Loans & Advances 56
90
120
140
161
Other Assets 19
45
40
47
54
Current liabilities
687
1,074
1,549
1,799
2,039
Net Current Assets
296
454
746
956
1,220
Deferred Tax Asset 40
49
49
49
49
Mis. Exp. not written off
-
-
-
-
-
Total Assets 1,082
1,346
1,643
1,853
2,112

Amber Enterprises India| 3QFY2020 Result Update
February 5, 2020
6
Consolidated Cashflow Statement
Y/E March (` cr) FY2018
FY2019
FY2020E
FY2021E
FY2022E
Profit before tax
89
136
235
283
347
Depreciation
49
62
84
89
94
Change in Working Capital (48)
(248)
(258) (174) (214)
Interest / Dividend (Net)
52
23
40
43
45
Direct taxes paid (17)
(30)
(59)
(71)
(87)
Others
2
(7)
0
0
0
Cash Flow from Operations
127
(63)
42
169
185
(Inc.)/ Dec. in Fixed Assets (101)
(118)
(90)
(90)
(90)
(Inc.)/ Dec. in Investments (51)
9
0
0
0
Cash Flow from Investing (152)
(109)
(90)
(90)
(90)
Issue of Equity
475
0
0
0
0
Inc./(Dec.) in loans (281)
118
122
0
0
Dividend Paid (Incl. Tax)
0
0
0
0
0
Interest / Dividend (Net) (70)
(34)
(40)
(43)
(45)
Cash Flow from Financing
124
83
82
(43)
(45)
Inc./(Dec.) in Cash
99
(89)
34
37
50
Opening Cash balances
35
134
45
78
115
Closing Cash balances
134
45
78
115
165

Amber Enterprises India| 3QFY2020 Result Update
February 5, 2020
7
Key Ratio
Y/E March FY2018
FY2019 FY2020E
FY2021E
FY2022E
Valuation Ratio (x)
P/E (on FDEPS) 77.8
51.8 27.7
23.1
18.8
P/CEPS 43.6
30.9 18.7
16.1
13.7
P/BV 5.4
4.8 4.1
3.5
2.9
Dividend yield (%) 0.0
0.0 0.0
0.0
0.0
EV/Sales 2.3
1.8 1.3
1.1
0.9
EV/EBITDA 26.3
23.7 14.8
12.7
10.7
EV / Total Assets 4.5
3.8 3.1
2.8
2.4
Per Share Data (Rs)
EPS (Basic) 19.8
29.8 55.6
66.9
82.2
EPS (fully diluted) 19.8
29.8 55.6
66.9
82.2
Cash EPS 35.4
50.0 82.6
95.6
112.4
DPS 0.0
0.0 0.0
0.0
0.0
Book Value 283.9
319.6
375.2
442.1
524.2
Returns (%)
ROCE 13.4
12.0 17.0
17.7
18.7
Angel ROIC (Pre-tax) 15.5
12.5 17.9
19.0
20.4
ROE 7.0
9.3 14.8
15.1
15.7
Turnover ratios (x)
Asset Turnover (Gross Block) 2.3
2.5 3.4
3.7
3.9
Inventory / Sales (days) 68
74
80
80
82
Receivables (days) 65
104
108
112
114
Payables (days) 99
128
128
128
126
Working capital cycle (ex-
cash) (days)
34
51
60
64
70

Amber Enterprises India| 3QFY2020 Result Update
February 5, 2020
8
Research Team Tel: 022
-
39357800 E
-
mail: research@angelbroking.com
Website: www.angelbroking.com
DISCLAIMER
Angel Broking Limited (hereinafter referred to as “Angel”) is a registered Member of National Stock Exchange of India Limited, Bombay
Stock Exchange Limited and Metropolitan Stock Exchange Limited. It is also registered as a Depository Participant with CDSL and Portfolio
Manager and Investment Adviser with SEBI. It also has registration with AMFI as a Mutual Fund Distributor. Angel Broking Limited is a
registered entity with SEBI for Research Analyst in terms of SEBI (Research Analyst) Regulations, 2014 vide registration number
INH000000164. Angel or its associates has not been debarred/ suspended by SEBI or any other regulatory authority for accessing
/dealing in securities Market. Angel or its associates/analyst has not received any compensation / managed or co-managed public
offering of securities of the company covered by Analyst during the past twelve months.
This document is solely for the personal information of the recipient, and must not be singularly used as the basis of any investment
decision. Nothing in this document should be construed as investment or financial advice. Each recipient of this document should make
such investigations as they deem necessary to arrive at an independent evaluation of an investment in the securities of the companies
referred to in this document (including the merits and risks involved), and should consult their own advisors to determine the merits and
risks of such an investment.
Reports based on technical and derivative analysis center on studying charts of a stock's price movement, outstanding positions and
trading volume, as opposed to focusing on a company's fundamentals and, as such, may not match with a report on a company's
fundamentals. Investors are advised to refer the Fundamental and Technical Research Reports available on our website to evaluate the
contrary view, if any
The information in this document has been printed on the basis of publicly available information, internal data and other reliable sources
believed to be true, but we do not represent that it is accurate or complete and it should not be relied on as such, as this document is for
general guidance only. Angel Broking Limited or any of its affiliates/ group companies shall not be in any way responsible for any loss
or damage that may arise to any person from any inadvertent error in the information contained in this report. Angel Broking Limited
has not independently verified all the information contained within this document. Accordingly, we cannot testify, nor make any
representation or warranty, express or implied, to the accuracy, contents or data contained within this document. While Angel Broking
Limited endeavors to update on a reasonable basis the information discussed in this material, there may be regulatory, compliance, or
other reasons that prevent us from doing so.
This document is being supplied to you solely for your information, and its contents, information or data may not be reproduced,
redistributed or passed on, directly or indirectly.
Neither Angel Broking Limited, nor its directors, employees or affiliates shall be liable for any loss or damage that may arise from or in
connection with the use of this information.
Ratings (Returns): Buy (> 15%) Accumulate (5% to 15%) Neutral (-5 to 5%)
Reduce (-5% to -15%) Sell (< -15%)
Disclosure of Interest Statement
Amber Enterprises India
1. Financial interest of research analyst or Angel or his Associate or his relative No
2. Ownership of 1% or more of the stock by research analyst or Angel or associates or relatives No
3. Served as an officer, director or employee of the company covered under Research No
4. Broking relationship with company covered under Research No